Weekly market pulse
A weekly LinkedIn market pulse for a Head of RevOps persona, grouping 320 real posts pulled from Trayo into nine themes with volume, trend, attributed quotes, a positioning read…
- Built in
- 10 min
- Capabilities
- 2
- Live API calls
- 11

The prompt
Paste it into any coding agent with the Trayo MCP connected.
- + any MCP client


Use Trayo to build a weekly market pulse. Let me name a persona — GTM engineer, Head of RevOps, CISO — and find what those people have been posting about over the last few weeks.

Group the posts into themes rather than listing them, and for each theme show how much it is being discussed, whether it is growing, and two or three representative quotes with attribution. End with what this implies for positioning and three content ideas that would land with this audience. Written to be read, not clicked through.
What this app asked Trayo for
Every name, number and email on the page came back from one of these. None of it was typed in.
- Reads your workspace
What you sell, who you sell to, and the buyer personas already saved in Trayo.
- Reads social activity
Posts and the people engaging with them, for plays that start from a conversation.
Take the tour
The same run as the video above, one stop at a time.
- 01
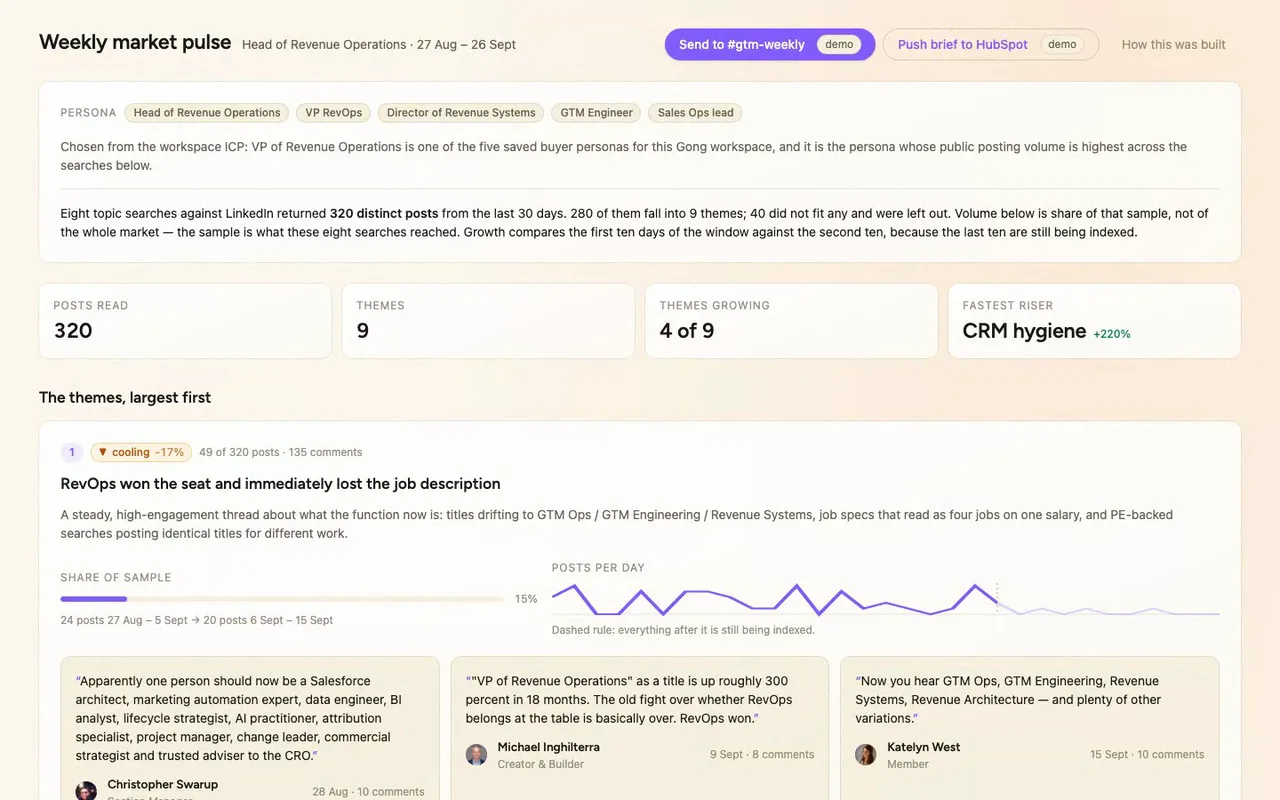
Our reps used to scroll LinkedIn by hand to see what RevOps leaders were saying. So we built a weekly market pulse for any persona they cover, and here it is for the Head of RevOps, with quotes they can actually use on a call.
- 02
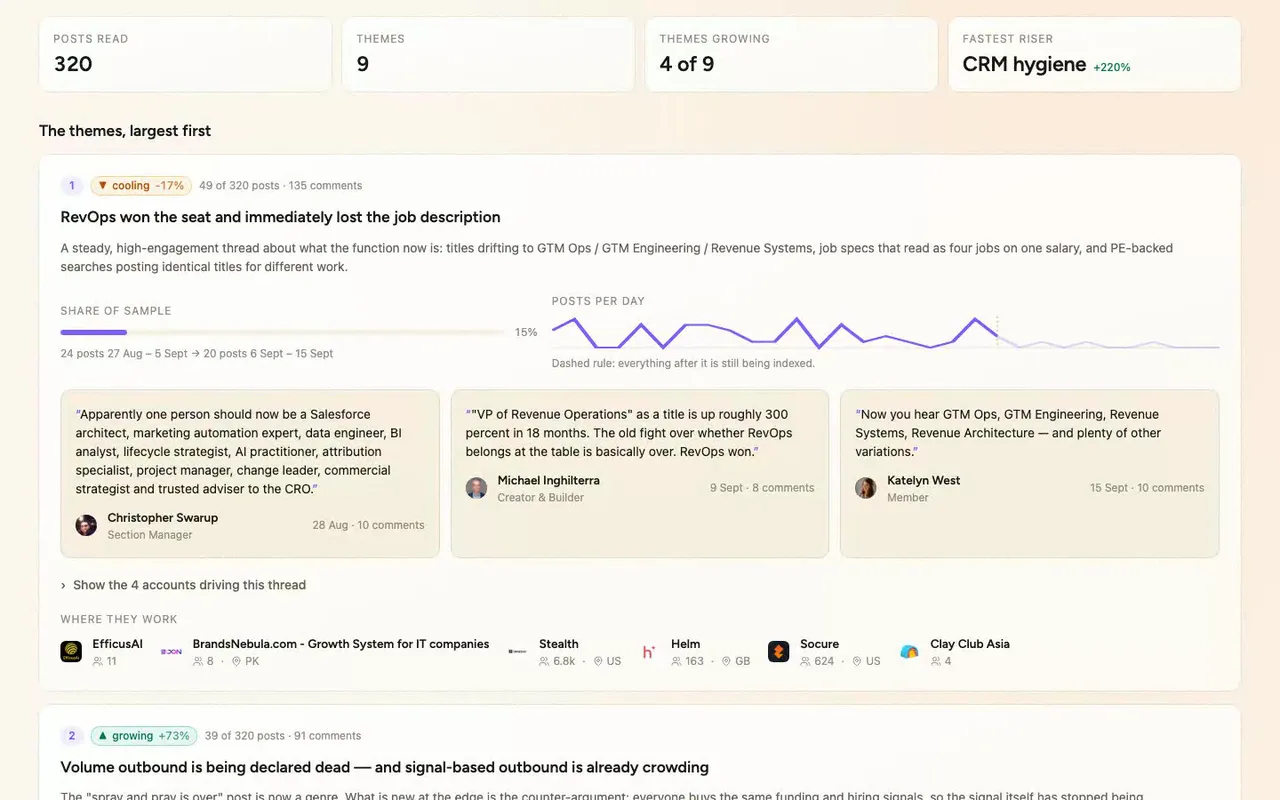
It opens with the persona and how the sample was built: 320 real LinkedIn posts, pulled from Trayo.
- 03
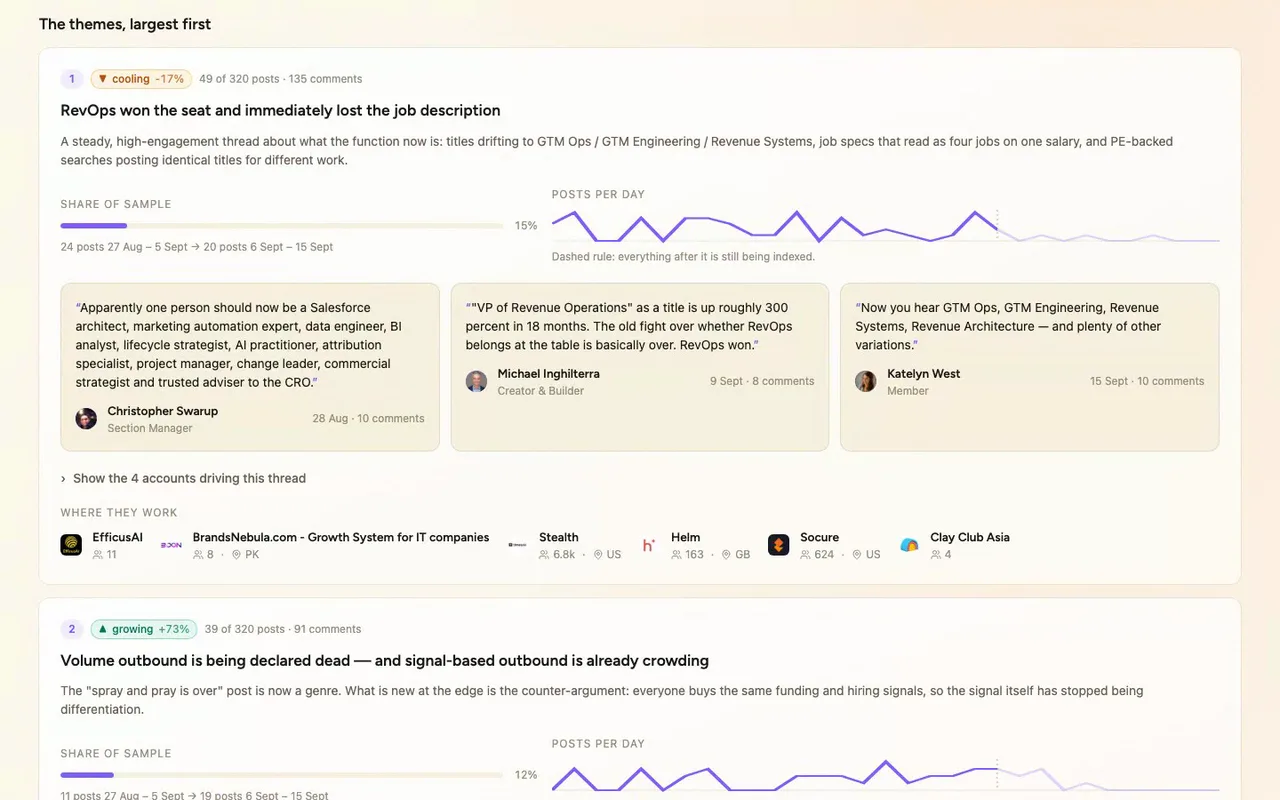
Nine themes, ordered by volume. Each shows its share of the sample, so you see what's loud first.
- 04
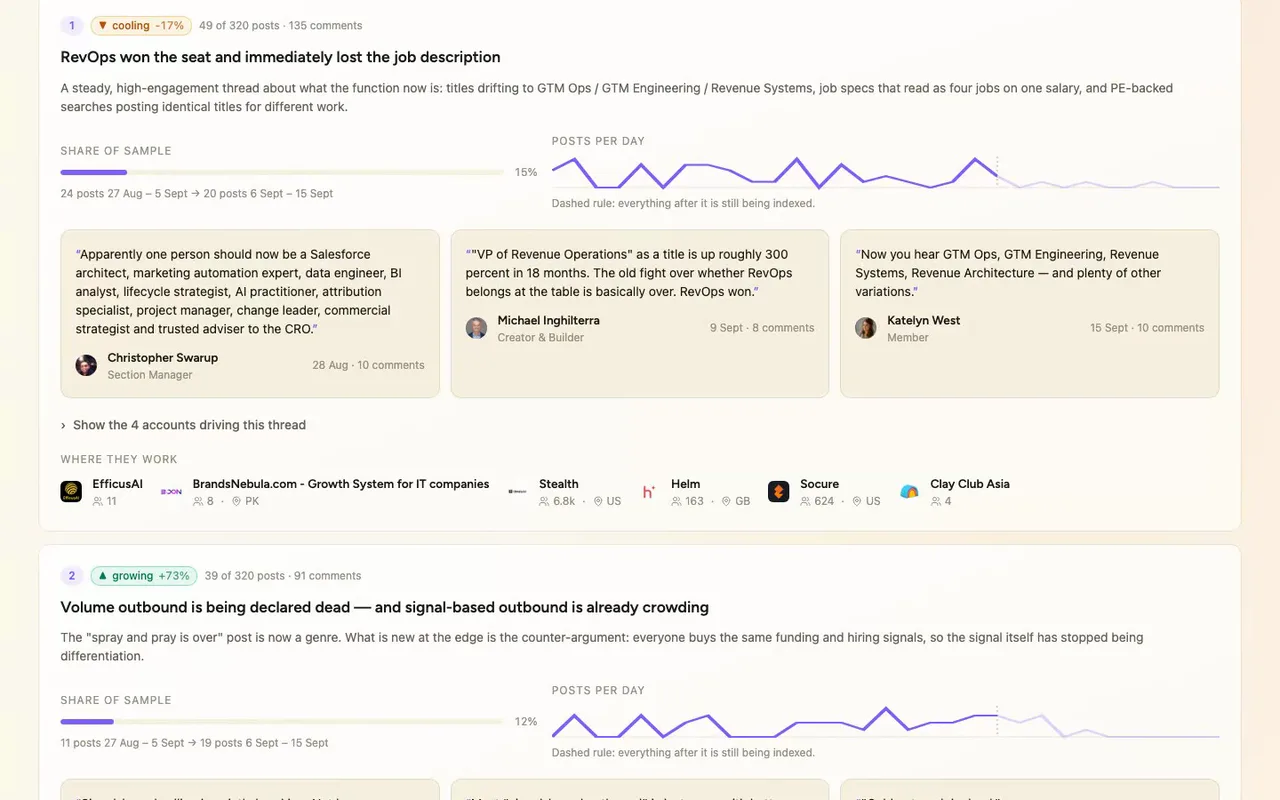
The trend compares the first and second half of the window, so you can see what's heating up and what's cooling.
- 05
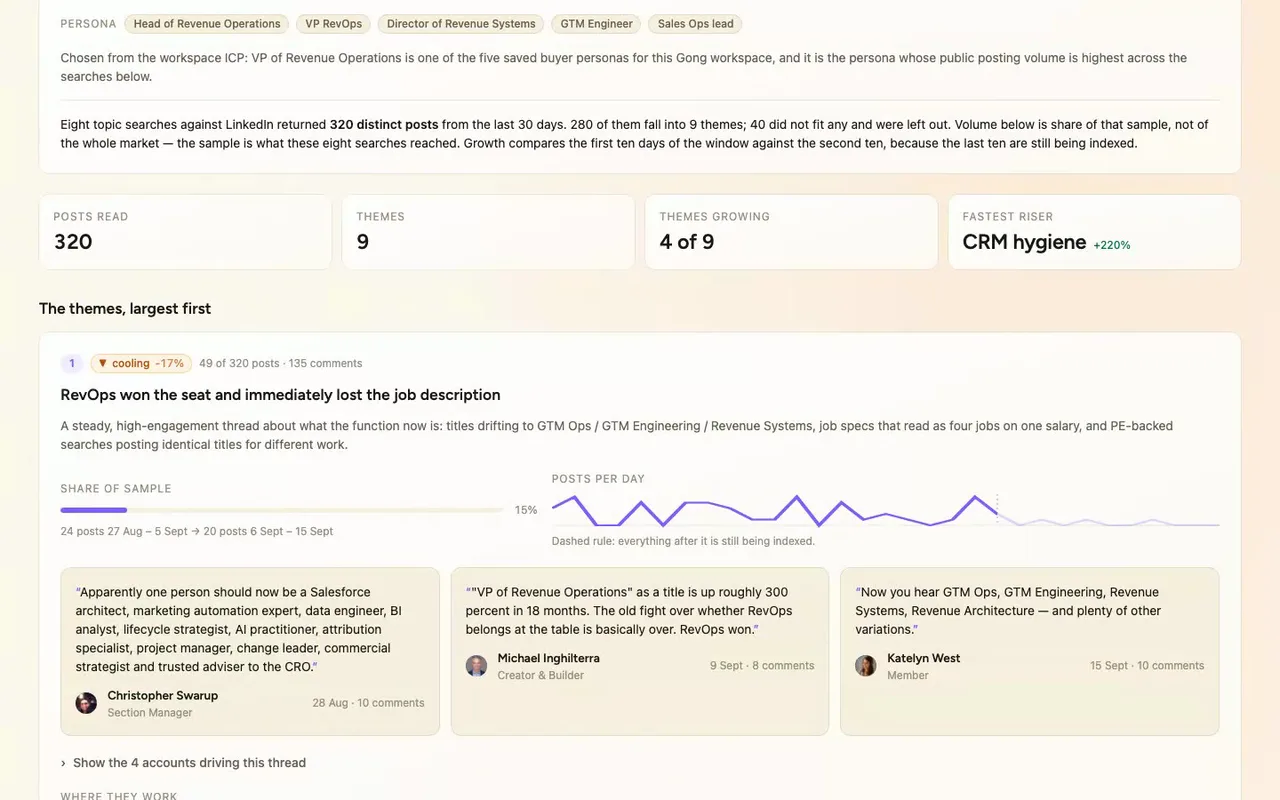
The sparkline is posts per day. The faded tail behind the dashed rule is the last ten days, which LinkedIn hasn't indexed yet.
- 06
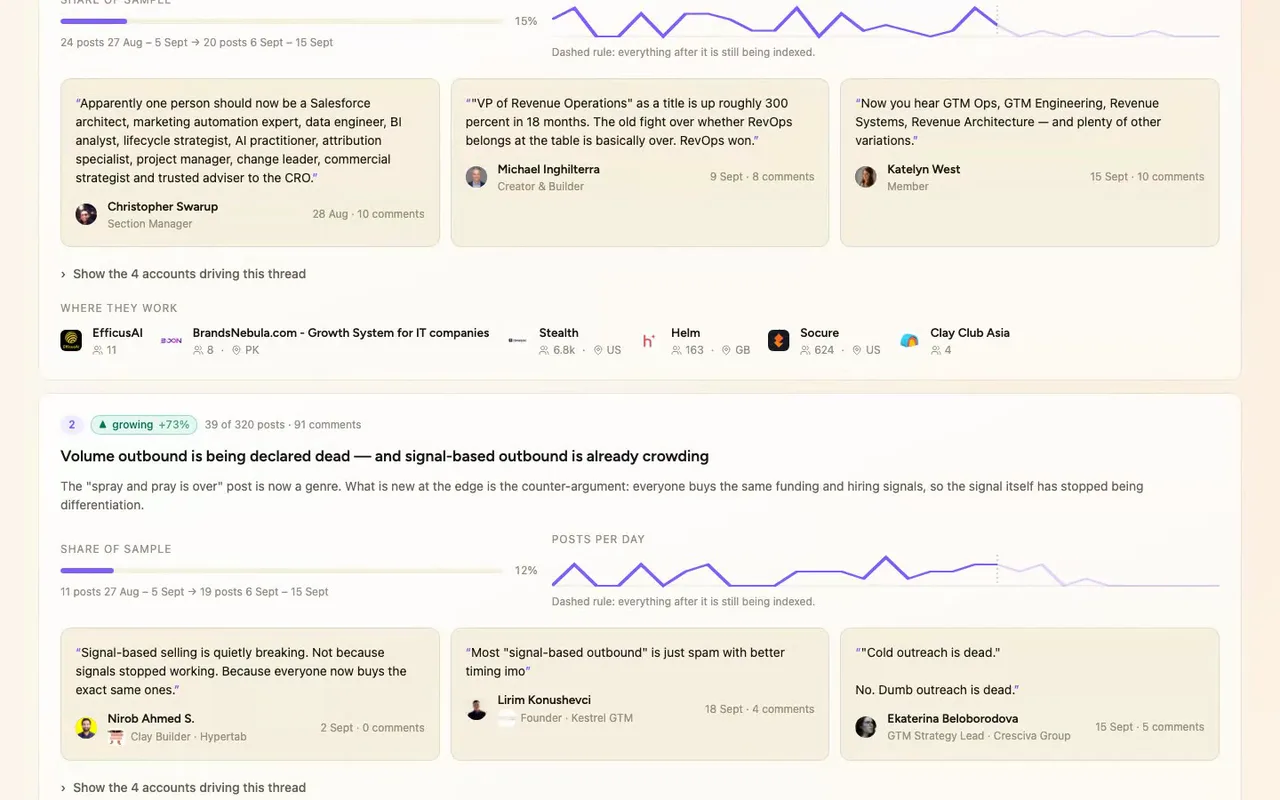
Every quote carries the author's real photo, title and company from Trayo, plus a link back to the post.
How it was built
The data behind each screen, and what's faked for the demo.
A salesperson covering RevOps buyers would open this the Monday before a week of calls, when they want to know what VPs and Heads of Revenue Operations have been posting about lately. They get a short read: nine themes ordered by volume, each with its share of the sample, whether it grew or cooled, a sparkline of posts per day, and two or three quotes with the author’s photo, title, company and a link back to the post. Under each theme they can open the accounts driving the thread. The page ends with what the pattern implies for positioning and three content ideas, each built from specific themes. They can bring those into a conversation or turn one into an outreach angle.
The alternative is scrolling LinkedIn by hand, copying quotes into a doc, and guessing which topics are picking up. That leaves you with a stale spreadsheet and no attribution you can trust. Here the grouping, the counts, the trend and the sourcing are already done, and every quote links to the original post. A second page, /method, shows the eight searches, the counting rules and a sortable table of everyone quoted, so you can check how a number was reached before repeating it to a buyer.
Nobody named a persona, so I checked the connection with trayo_whoami and then read the Gong workspace with trayo_get_workspace. VP of Revenue Operations is one of the five buyer personas saved there, so I used that as the audience. Then I ran eight trayo_search_posts calls over a 30-day window, 27 Aug to 26 Sep 2026. They returned 320 distinct LinkedIn posts, with no overlap between searches. I grouped those into nine themes. Every author name, headline, company, logo and profile photo on the page is a field Trayo returned. I checked each quote against the post text and only let it into the dataset if it appeared verbatim. Posts reach the index about ten days late, so the trend compares 27 Aug to 5 Sep against 6 to 15 Sep and leaves out everything from 16 Sep on. I draw that tail faded behind a dashed rule in each sparkline so it doesn’t read as a decline.
The data is real, but it is a sample. Eight searches capped at 40 results each shape it, so a theme at 15% is 15% of these 320 posts and not of everything RevOps leaders posted. The Slack, HubSpot and “draft it” buttons are stubs. Each carries a demo tag and raises a toast saying what would have been sent, and nothing leaves the browser. I stubbed them because the demo is about the read, and wiring real sends would mean touching someone’s actual Slack or CRM.